Sunday 4 January 2015

DIY Gas Chromatograph

Why Bother?

A while ago I started looking at making a biogas generator, but didn't commission it because I had no way of detecting what gases were coming off it.   A few weeks ago I was inspired by someone showing that they had made a DIY gas chromatograph, so thought that if I made one, we could do real experiments on biogas production from household waste to see what works best etc.....

So, our litle project for this Christmas holiday was to make ourselves a DIY gas chromatograph and see if we could use it to detect the difference between CO2 and Methane, which are the two main products I expect to see from the fermentation to produce biogas.

Note that when I talked to some chemists about this they advised that I could do this much more easily using wet chemistry because of the significant differences between CO2 and Methane, but I am a physicist, so something using physical properties sounds much more fun!   (It is also much more of a useful education project for Laura, but she didn't know that at the start).

The Principles

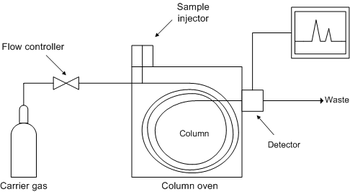
A gas chromatograph relies on a constant flow of carrier gas passing through a 'column', which is in a temperature controlled oven.    You inject the sample gas into the flow at the inlet of the column, and the constituent parts travel through the column at different rates, so the different constituents come out of the column at different times after injection.  See pretty picture from wikipedia article below.

Components of a DIY Chromatograph

Infrastructure

The infrastructure (temperature measurement, temperature control, detector control etc.) can be done using an arduino microcontroller.

Arduino Based Temperature Controller

This was Laura's part of the project - she developed an Arduino programme (sketch) that does the following:
  • Measures the resistance of thermistors (assuming they are wired as a potential divider).
  • Converts the resistance to temperature in degC.
  • Performs 3 term (PID) temperature control by varying an 'analogue' output pin to control the oven temperature (see below for oven details).
  • Outputs relevant data (temperatures etc.) to the controlling computer using the USB serial connection on the arduino.
  • Responds to commands from the USB serial line to change set point, PID gains etc.

User Interface

We had a difficult design choice for user interface - do we write a 'native' user interface on a computer connected to the arduino, or make a web based system?
I decided to go for a web based system, which means that you can use any computer as the user interface, so we need a little web server.   Although some people use Arduino's for this, I thought it would be much easier to use a Raspberry Pi.
We re-cycled the web server code from our Seizure Detector project, which is a simple python web server.
The python programme does the following:
  • Listen for web requests.
  • If no special commands are given, it serves a simple page showing the chromatograph settings and a graph of the temperature history (which will also be the detector output). 
  • The main web page includes javascript code to allow bits of it to be updated without refreshing the whole page every time (the html/javascript code is Laura's).
  • Respond to specific commands (such as change set point) by sending these to the arduino across the serial line.
  • Collect data from the arduino (it sends a set of data every second), and create at time series.
  • Use the time series data to plot a graph of temperature history etc.

The web server code is the python files here: https://github.com/jones139/arduino-projects/tree/master/gc  (execute runServer.py) to start the web server.

The html and javascript based user interface is all here: https://github.com/jones139/arduino-projects/tree/master/gc/www.

The infrastructure part went well - we have a web interface to a three term temperature controller that works fine, and sends data back to the web server, which produces a graph of the temperature history.  You can change set point, controller gains etc over the web interface.

Power Supply and Case

We will need a variety of power supplies (5V for the Raspberry Pi, 12V for heaters, mains for the pump).   I had an old computer case in the Attic, so we used that - it has a power supply that gives 5V, 12V high current, +/-12V and 3.3V, so plenty for what we need.    The case will also house the finished instrument so it will look neater than most of my projects once I put the lid on!
The case for the project!
Case before I removed the old computer boards to make room. - the power supply is at the back.
 The ATX power supply does not start up when the unit is powered on - you needed to press the on button on the case, which energised a line to the power supply via the main computer board.   You can force the power supply to run by shorting a particular pin on the main connector down to ground:


Carrier Gas

To keep things simple I propose to use air as the carrier gas, and use a fish tank air pump to push it through the column.    Because it is a bit noisy, we made the Arduino and web interface allow you to switch it on and off easily.  The pump is mains powered so we used a solid state relay to switch it on and off, and covered the mains connections with plastic to stop us blowing ourselves up with loose wires in the case...
The air pump with sample injector syringe.

Solid state relay mounted in bottom of the case - all the mains connections are covered in clear plastic to avoid them contacting low voltage parts of the equipment.

Oven

For the oven we need an insulated case and some heaters.   For the case we used the old CD drive case from the computer, because it fits in the computer case neatly:

We added some polystyrene insulation to the top to reduce heat loss, and a bit of bubble wrap to the bottom (could not get too much in, or there would be no room in the oven....
The heater element is an aluminium plate cut to the size of the oven with three resistors bolted to it.
A power transistor is also mounted in the case to switch the current flow to the resistors.  This means that the 12V power supply only has to go to the oven, and we can provide a 5V switching signal from the arduino to control the heater using the transistor:
Heater plate with resistors attached, along with power transistor to control the heater current.   Note that we had to disconnect the transistor heat sink from the plate because grounding it to earth switched on the transistor, so we had an over-heat fault on first commissioning - the arduino tried to switch off the heaters, but they continued at full power - at least we proved that we can get the oven to just over 90degC...
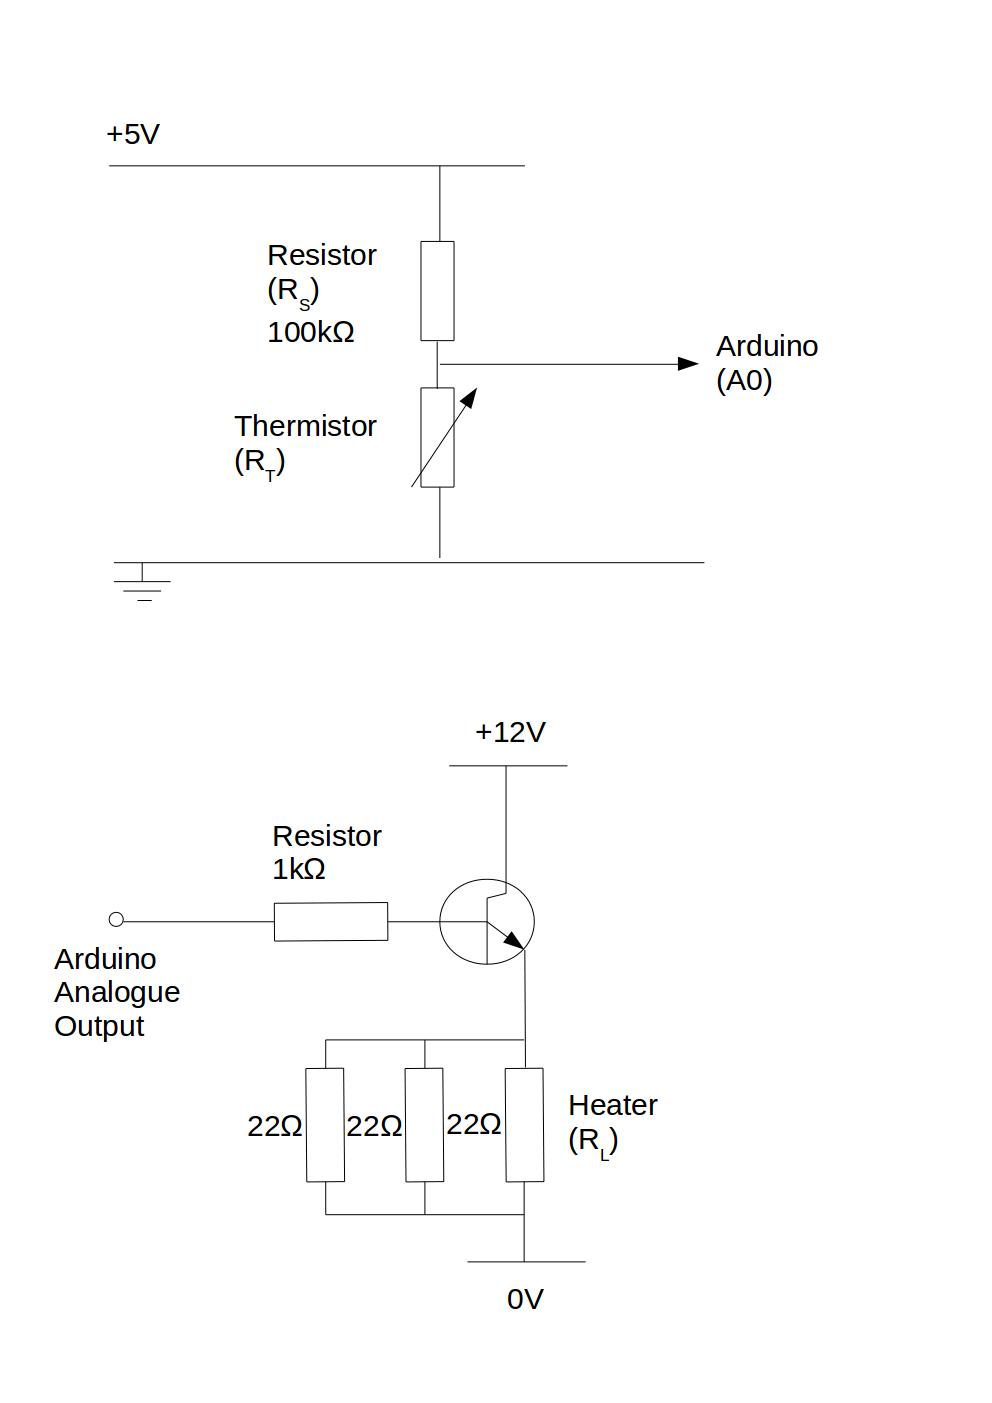
Circuit diagrams for the thermistor measurement and the heater control circuit.

Detector

The detector is my part, and is the bit that is holding up the project at the moment!

First Version - heat loss to environment

My first go was to rely on the gas coming out of the oven being hot, and looking at the amount of cooling of the sample gas compared to pure carrier gas as it passed through some copper tubes:

Unfortunately the gas flow rate is so low that the gas has cooled to ambient temperature before it gets to the detector, so I can't measure anything useful, so need a re-think.

Second version - heated constantan wire

Next, try a hot wire detector - loop of constantan wire used to heat a thermistor using a constant current source - the temperature above ambient should depend on the thermal properties of the gas surrounding it.

Here my lack of practice at electronics design let me down - I made a high current source using a trusty (>30 year old) 741 op-amp and a power transistor.   
Arduino, along with 741 and power transistor current source (the sense resistor is the big grey cylinder above the arduino).  The things in the crocodile clip are the heated and ambient thermistors.

Unfortunately I was using a 100R resistor to sense the current, and my loop of constantan is only about 1R.   This meant that I put a lot more power into the sense resistor than my 'hot' wire - no detectable increase in wire temperature, but smoke and a warming glow from the sense resistor....   Replaced it with the more robust resistor shown in the picture above, which acts as a nice room heater, but no measurable heating of the thermistor.

So, need a higher resistance heater for the thermistor - think I will dismantle a 12V light bulb next....

Summary

Quite an interesting holiday project, but not finished.  
What went well:
  • Working web interface to an arduino temperature controller
  • Working web based data logger.
  • Working oven and switchable pump.
  • Nice case with useful power supply.
  • Laura learned to programme an Arduino, and write javascript web pages

What didn't go well:
  • The detector!
  • I am out of practice at electronics design, and mis-judged heat losses from very very low gas flow rates!


Sunday 26 October 2014

Alternative Operating System (Cyanogenmod) on Samsung S4 mini

My Samsung S4 mini Android mobile phone works very well, but it keeps running out of internal storage space for applications, so in practice I can not have very many of my own applications on the device.

I realised this is because the phone came with a lot of applications pre-installed, which keep getting updated, and the updates take up storage space (in addition to the factory installed version, which is not replaced).   And I don't use most of the applications that are installed on it - no need for things like Google Maps when you can use OsmAnd navigation etc. whcih uses OpenStreetMap data so is more detailed.

So tonight I decided to try installing cyanogenmod, which is another build of Android that can replace the factory firmware.    I found this a bit nerve wracking because I was doing it as a bit of a 'black box' - download this file, press these buttons etc.   There are also several versions of a S4 mini (mine is a GT-I9192, which seems to be less common).   If I were doing it on a Windows computer I would be very worried about viruses etc. - still nervous about the firmware that I have downloaded - might try to build it from source another day to give me a bit more confidence.

The end result is my phone seems to work, running cyanogenmod 11, which is good

Don't treat this as instructions of how to do it - it is just my notes so I can remember.

Recovery Image
The S4 mini has a recovery mode, which seems to be a very small operating system.   You need a replacement for this which will let you do more  things (like backup your existing firmware before you start anything more serious).
There are a few different alternative recovery systems around, but the one I found that claims to work on an I9192, is called 'Philz' which is a more advanced version of one called 'clockworkmod'.

I got the latest version of Philz recovery from the link here.    And loaded it onto the device using the 'heimdal' software running on my xubuntu linux laptop (I just used the ubuntu packaged version rather than building from source) - I did this by following the instructions here.

It is now possible to boot the phone into recovery mode by pressing the Volumme Up, Home and Power buttons when booting.

Install Cyanogenmod
The extra worrying part is that you need the version of cyanogenmod that matches your phone (not sure what will happen if you don't, but it might take a bit of recovering from...).   I searched the internet to find an unofficial version for my phone (GT-I9192), and got the latest version from here, which is referenced from a post on the xda developers forum.

This went surprisingly smoothly - you can set the recovery program to install a 'zip' image from sideloader, and send the image using 'adb sideload '.

Re-booted and the phone works again, phew!.

Google Apps
One issue with the 'stock' cyanogenmod is that it does not include any of the propriatory google applications, in particular I wanted GMail, Google Plus and the play store.
While it is possible to back them up from the factory firmware, and then restore them into cyanogenmod, you can get pre-packaged versions on the internet (may be issues with licencing here I suspect...), which are packaged as 'gapps' and can be loaded as a 'zip' file the same way as cyanogenmod.

This now gives me a working gmail etc., and i can install other apps like osmand, national rail etc. using play store.

Unfortunately I have installed loads of other google apps that I don't really want, which slightly defeats the object of  going to an alternative firmware - I might have to look at doing the backup and restore bit myself and being more selective about what I back up....

So, I think I have got back to a working phone - I'll have to test it a bit this week before I go travelling again and need it more.

Sunday 28 September 2014

Charity Document Management System

After a bit more development of the Document Management System for our Academy Charitable Trust (HDMS), I have now got something working which I think is useable.    There may well be some changes once we use it in anger for a while and find some 'features' annoying!


Background

HDMS is a Document Management System that has been developed for Hartlepool Aspire Trust (Catcote Academy).
It has been developed because the Trust is expected to have many policies to ensure compliance with statutory regulations, and these policies are implemented within the trust using procedures for detailed instructions, and forms to record information.
It is important that the latest versions of the Policies, Procedures and Forms are available to staff and key stakeholders, and that changes between versions can be tracked and communicated to stakeholders so they know what has changed when a new document is issued.

User Interface

HDMS has been developed to store the Trust's documents in a single repository (a web server) and present the latest version of documents to interested parties. Users are initially presented with a graphical summary of the document structure.
Screenshot Image The user clicks on parts of the graphical summary to search for specific types of documents (such as Financial Procedures, or Human Resources Policies). This gives a list of documents, showing the latest revision number with date of issue, with clickable icons to download either the PDF version or native version of the file.
Screenshot ImageAuthorised users have options to create new revisions, or edit existing draft documents.
Draft versions of documents are not publicly visible, but can be viewed by authorised users. Approval and issue of documents is managed by the draft document being sent electronically to reviewers/approvers.
The document is issued and becomes the latest version once all the reviewers/approvers have approved the document.
The workflow for creating, revising and approving a document is shown in a set of slides here.
The system stores both 'native' (e.g. MS Word) documents and PDF documents. By default the PDF version is delivered to the public, as this can not be modified accidentally. The system can also store 'extra' files, which may be the source files for drawings or tables of data that are used in the document - this is useful for future updates so the author can obtain all the data used to produce the original document.

Live Version

The live version of the system is running at (http://catcotegb.co.uk/hdms).
The software is quite general so may be of use to other small and medium size organisations who wish to manage their documentation in a systematic way. There is a demonstration version of the system available for testing at http://catcotegb.co.uk/hdms_demo - login as 'user1' with password 'test').   The source code is available on my GitHub repository.
Please let me know if you are interested in using this for your organisation and I will help explain how to set it up, because my installation instructions may not be complete!

Friday 29 August 2014

Academy Charitable Trust Document Management System

Last year our school converted to an academy.   To help us with the set-up of the administrative side of the new organisation, I set up an electronic document management system to hold our management documents such as policies and procedures.

The system I set up was a modified version of OpenDocMan.   This has worked pretty well from the point of view of recording the documents and allowing us to retrieve the issued version, but now we are looking at updating some of the documents, and establishing another part of the organisation, we are finding some limitations.   The most significant problem is that the document does not appear publicly while it is waiting for approval - I want the latest issued document to always be available even while we are reviewing and approving the new version.

I decided that rather than modifying my version of OpenDocMan, it is probably better to write an alternative simple system based on an established software framework.

The new Hartlepool Aspire Trust Document Management System (HDMS) is based on the cakephp framework, which makes interfacing with the database, and dealing with internet http requests very simple, and it automatically produced the code to do basic database record creation/deletion etc. automatically, so I only had to do the 'business' logic.

The concepts for the new system and workflow are shown in these slides, and there is a demo installation here.

Monday 13 January 2014

Breathing Detection with Kinect - A working Prototype Seizure Detector!

The seizure detector project has come forward a long way since I have been using the Kinect.
I now have a working prototype that monitors breathing and can alarm if the breathing rate is abnormally low.   It sends data to our 'bentv' monitors (image right), and has a web interface so I can see what it is doing (image below).   It is on soak test now.....

Details at http://openseizuredetector.org.uk.


Sunday 5 January 2014

Breathing Detection using Kinect and OpenCV - Part 2 - Peak detection

A few days ago I published a post about how I am using a Microsoft Kinect depth camera and the OpenCV image processing library to identify a test subject from a background, and analyse the series of images from the camera to detect small movements.

The next stage is to calculate the brightness of the test subject at each frame, and turn that into a time series so we can see how it changes with time, and analyse it to detect specific events.

We can use the openCV 'mean' function to work out the average brightness of the test image easily, then just add it onto the end of an array, and trim the first value off the start to keep the length the same.
The resulting image and time series are shown below:

 The image here shows that we can extract the subject from the background quite accurately (this is Benjamin's body and legs as he lies on the floor).  the shading is the movement relative to the average position.


The resulting time series is shown here - the measured data is the blue spiky line.  The red one is the smoothed version (I know I have a half second offset between the two...).

The red dots are peaks detected using a very simple peak searching algorithm.
The chart clearly shows a 'fidget' being detected as a large peak.  There is a breathing event at about 8 seconds that has been detected too.

So, the detection system is looking promising - I have had better breathing detection when I was testing it on myself - I think I will have to change the position of the camera a bit to improve sensitivity.

I have now set up a simple python based web server to allow other applications to connect to this one to request the data.

We are getting there.  The outstanding issues are:

  • Memory Leak - after the application has run for 30 min the computer gets very slow and eventually crashes - I suspect a memory leak somewhere - this will have to be fixed!
  • Optimum camera position - I think I can get better breathing detection sensitivity by altering the camera position - will have to experiment a bit.
  • Add some code to identify whether we are looking at Benjamin or just noise - at the moment I analyse the largest bright subject in the image, and assume that is Benjamin - I should probably have a minimum size limit so it gives up if it can not see Benjamin.
  • Summarise what we are seeing automatically - "normal breathing", "can't see Benjamin", "abnormal breathing", "fidgeting" etc.
  • Modify our monitors that we use to keep an eye on Benjamin to talk to the new web server and display the status messages and raise an alarm if necessary.
The code is available here.


Wednesday 1 January 2014

Breathing Detection using Kinect and OpenCV - Part 1 - Image Processing

I have had a go at detecting breathing using an XBox Kinnect depth sensor and the OpenCV image processing library.
I have seen a research paper that did breathing detection, but it relied on fitting the output of the Kinect to a skeleton model to identify the chest area to monitor.  I would like to do it with a less calculation intensive route, so am trying to just use image processing.

To detect the small movements of the chest during breathing, I am doing the following:
Start with a background depth image of empty room.

Grab a depth image from kinect
Subtract Background so we have only the test subject.


Subtract a rolling average background image, and amplify the resulting small differences - makes image very sensitive to small movements.


Resulting video shows image brightness changing due to chest movements from breathing.

We can calculate the average brightness of the test subject image - the value clearly changes due to breathing movements - job for tomorrow night is to do some statistics to work out the breathing rate from this data.

The source code of the python script that does this is the 'benfinder' program in the OpenSeizureDetector archive.

Tuesday 31 December 2013

A Microsoft Kinect Based Seizure Detector?

Background

I have been trying to develop an epileptic seizure detector for our son on-and-off for the last year.   The difficulty is that it has to be non-contact as he is autistic and will not tolerate any contact sensors, and would not lie on a sensor mat etc.
I had a go at a video based version previously, but struggled with a lot of noise, so put it on hold.

At the weekend I read a book "OpenCV Computer Vision with Python" by Joseph Howse - this was a really good summary of how to combine openCV video processing into an application - dealing with separating user interface from video processing etc.   Most significantly he pointed out that it is now quite easy to use a Microsoft Kinect sensor with openCV (it looked rather complicated earier in the year when I looked), so thought I should give it a go.

Connecting Kinect

When I saw a Kinect sensor in a second hand gadgets shop on Sunday, I had to buy it and see what it can do.

The first pleasant surprise that I got was that it came with a power supply and had a standard USB plug on it (I thought I would have to solder a USB plug onto it) - I plugged it into my laptop (Xubuntu 13.10), and it was immediately detected as a Video4Linux webcam - a very good start.

System Software

I installed the libfreenect library and its python bindings (I built it from source, but I don't think I had to - there is an ubuntu package python-freenect which would have done it).

I deviated from the advice in the book here, because the Author suggested using the OpenNI library, but this didn't seem to work - looks like they no longer support Microsoft Kinect sensors (suspect it is a licensing issue...).   Also the particularly clever software to do skeleton detection (Nite) is not open source so you have to install it as a binary package, which I do not like.   It seems that the way to get OpenNI working with Kinect is to use a wrapper around libfreenect, so I decided to stick with libfreenect.

The only odd thing is whether you need to be root to use the kinect or not - sometimes it seems I need to access it as root, then after that it works as a normal user - will think about this later - must be something to do with udev rules, so not a big deal at the moment....

BenFinder Software

To see whether the Kinect looks promising to use as a seizure detector, wrote a small application based on the framework in Joseph Howse's book.   I had to modify it to work with libfreenect - basically it is a custom frame grabber.
The code does the following:
  • Display video streams from kinect, from either the video camera or the infrared depth camera on the kinect - works!  (switch between the two with the 'd' key).
  • Save an image to disk ('s' key).
  • Subtract a background image from the current image, and display the resulting image ('b' key).
  • Record a video (tab key).

The idea is that it should be able to distinguish Benjamin from the background reliably, so we can then start to analyse his image to see if his movements seem odd (those who know Benjamin will know that 'odd' is a bit difficult to define for him!).

Output

I am very pleased with the output - it looks like it could work - a few images:

Output from Kinect Video Camera (note the clutter to make detection difficult!)
Kinect Depth Camera Output - Note black hole created by open door.


Depth Camera Output with background image subtracted - note that the subject stands out quite clearly.
Example of me trying to do Benjamin-like behaviours to see if I can be detected.

Conclusion & What Next

Background subtraction from the depth camera makes the test subject stand out nice and clearly - should be quite easy to detect him computationally.
Next stage is to see if the depth camera is sensitive enough to detect breathing (when lying still) - will try by subtracting an each image from the average of the last 30 or so, and amplifying the differences to see if it can be seen.
If that fails, I will look at Skeltrack to fit a body model to the images and analyse movement of limbs (but this will be much more computationally costly).
Then I will have to look at infrastructure to deploy this - I will either need a powerful computer in Benjamin's room to interface with the Kinect and do the analysis, or maybe use a Raspberry Pi to interface with the kinect and serve the depth camera output as a video stream.

Looking promising - will add another post with the breathing analysis in the new year...

Thursday 5 December 2013

Using a Kobo Ebook Reader as a Gmail Notifier

A certain person that I know well does not read her emails very often and sees it as a chore to switch on the computer to see if she has any.  And no, I can't interest her in a smartphone that will do email for her....This post is about making a simple device to hang on the wall like a small picture next to the calendar so she can always see if she has emails to know if it is worth putting the computer on.

I was in WH Smith the other day and realised that they were selling Kobo Mini e-book readers for a very good price (<£30).   When you think about it the reader is a small battery powered computer with wifi interface, a 5" e-ink screen with a touch screen interface.    This sounds like just the thing to hang on the wall and use to display the number of un-read emails.

Fortunately some clever people have worked out how to modify the software on the device - it runs linux and the manufacturers have published the open source part of the device firmware (https://github.com/kobolabs/Kobo-Reader).   I haven't done it myself, but someone else has compiled python to run on the device and use the pygame library to handle writing to the screen (http://www.mobileread.com/forums/showthread.php?t=219173).  Note that I needed this later build of python to run on my new kobo mini as some of the other builds that are available crashed without any error messages - I think this is to do with the version of some of the c libraries installed on the device.
Finally someone called Kevin Short wrote a programme to use a kobo as a weather monitor, which is very similar to what I am trying to do and was a very useful template to start from - thank you, Kevin! (http://www.mobileread.com/forums/showthread.php?t=194376).

The steps I followed to get this working were:

  • Enable telnet and ftp access to the kobo (http://wiki.mobileread.com/wiki/Kobo_Touch_Hacking)
  • Put python on the 'user' folder of the device (/mnt/onboard/.python).
  • Extend the LD_LIBRARY_PATH in /etc/profile to point to the new python/lib and pygame library directories.
  • Add 'source /etc/profile' into /etc/init.d/rcS so that we have access to the python libraries during boot-up.
  • Prevented the normal kobo software from starting by commenting out the lines that start the 'hindenburg' and 'nickel' applications in /etc/init.d/rcS.
  • Killed the boot-up animation screen by adding the following into rcS:
          killall on-animator.sh
          sleep 1
  • Added my own boot-up splash screen by adding the follwing to rcS:
          cat /etc/images/SandieMail.raw | /usr/local/Kobo/pickel showpic 
  • Enabled wifi networking on boot up by referencing a new script /etc/network/wifiup.sh in rcS, which contains:
          insmod /drivers/ntx508/wifi/sdio_wifi_pwr.ko
          insmod /drivers/ntx508/wifi/dhd.ko
          sleep 2
          ifconfig eth0 up
          wlarm_le -i eth0 up
          wpa_supplicant -s -i eth0 -c /etc/wpa_supplicant/wpa_supplicant.conf -C         /var/run/wpa_supplicant -B sleep 2
          udhcpc -S -i eth0 -s /etc/udhcpc.d/default.script -t15 -T10 -A3 -f -q
  • Started my new gmail notifier program using the following in rcS:
          cd /mnt/onboard/.apps/koboGmail
          /usr/bin/python gmail.py > /mnt/onboard/gmail.log 2>&1 &
The actual python program to do the logging is quite simple - it uses the pygame program to write to a framebuffer screen, but uses a utility called 'full_update' that is part of the kobo weather project to update the screen.   The program does the following:
  • Get the battery status, and create an appropriate icon to show battery state.
  • Get the wifi link status and create an appropriate icon to show the link state.
  • Get the 'atom' feed of the user's gmail account using the url, username and password stored in a configuration file.
  • Draw the screen image showing the number of unread emails, and the sender and subject of the first 10 unread mails, and render the battery and wifi icons onto it.
  • Update the kobo screen with the new image.
  • Wait a while (5 seconds at the moment for testing, but will make it longer in the future - 5 min would probably be plenty).
  • Repeat indefinitely.
The source code is in my github repository.

The resulting display is pretty basic, but functional as shown in the picture.

Things to Do

There are a few improvements I would like to make to this:
  1. Make it less power intensive by switching off wifi when it is not needed (it can flatten its battery in about 12 hours so will need to be plugged into a mains adapter at the moment).
  2. Make it respond to the power switch - you can switch it off by holding the power switch across for about 15 seconds, but it does not shutdown nicely - no 'bye' display on the screen or anything like that - just freezes.
  3. Get it working as a usb mass storage device again - it does usb networking at the moment instead, so you have to use ftp to update the software or log in and use vi to edit the configuration files - not user friendly.
  4. Make it respond to the touch screen - I will need to interpret the data that appears in /dev/input for this.  The python library evdev should help with interpreting the data, but it uses native c code so I need a cross compiler environment for the kobo to use that, which I have not set up yet.  Might be as easy to code it myself as I will only be doing simple things.
  5. Get it to flash its LED to show that there are unread emails - might have to modify the hardware to add a bigger LED that faces the front rather than top too.
  6. Documentation - if anyone wants to get this working themselves, they will need to put some effort in, because the above is a long way off being a tutorial.   It should be possible to make a kobo firmware update file that would install it if people are interested in trying though.


Tuesday 22 October 2013

Raspberry Pi and Arduino

I am putting together a data logger for the biogas generator.

I would like it networked so I don't have to go out in the cold, so will use a raspberry pi.   To make interfacing the sensors easy I will connect the Pi to an Arduino microcontroller.   This is a bit over the top as I should be able to do everything I need using the Pi's GPIO pins, but Arduino has a lot of libraries to save me programming....

To get it working I installed the following packages using:
apt-get install gcc-avr avr-libc avrdude arduino-core arduino-mk

To test it, copy the Blink.ino sketch from /usr/share/arduino/examples/01.Basics/Blink/ to a user directory.
Then create a Makefile in the same directory that has the following contents:
ARDUINO_DIR  = /usr/share/arduino
TARGET       = Blink
ARDUINO_LIBS =
BOARD_TAG    = uno
ARDUINO_PORT = /dev/ttyACM0
include /usr/share/arduino/Arduino.mk
Then just do 'make' to compile it, then upload to the arduino (in this case a Uno) using:
avrdude -F -V -p ATMEGA328P -c arduino -P/dev/ttyACM0  -U build-cli/Blink.hex
The LED on the Arduino Uno starts to blink - success!

Saturday 19 October 2013

Small Scale Biogas Generator

I heard on the radio last week that some farmers are using anaerobic digesters to produce methane-rich biogas from vegetable waste.
This got me wondering if we could use our domestic waste to produce usable fuel gas - maybe to heat the greenhouse or something similar.

I thought I would make a small scale experimental digester to see if it works, and what amount of gas it makes, to see if it is worth thinking about something bigger.

My understanding is that the methane producing bacteria work best at over 40 degC, so I will heat the digester.  I will do this electrically for the experimental set up because it is easy, and I can measure the energy consumption easily that way.

I am using a 25 litre fermentation vessel for the digester - I got one with a screw on cap rather than a bucket so I can run it at slightly elevated pressure if it starts to make gas.
For simplicity I got a 1 m2 electric underfloor heating blanket to heat the vessel.  I will use an electro-mechanical thermostat as a protection device in case the electronic temperature controller I will produce looses its marbles and tries to melt the vessel.


To start with I just wrapped the blanket around the vessel.

But before I tested it I realised that this approach is no good - the vessel will not be full of liquid, so I do not want the heating element all the way up the sides.


So, I removed the heating element from the underfloor heating mat, and wrapped it around the bottom of the vessel instead.


To improve heat transfer between the heating element and the vessel, I pushed as much silicone grease as I could get in around the element wires, then wrapped it in gaffer tape to make sure it all held together and I don't get covered in grease:

It is looking promising now - the element gets warm, and the thermostat trips it out when it starts to get hot.  The dead band on the thermostat is too big to be useful for this application (it is about 10 degC), so I will just use that as an over-heat protection device, and us an Arduino microcontroller to control and log the temperature.

To get the proof of concept prototype working, I think I need to:
  • Sort out a temperature controller - will use an arduino and a solid state relay to switch the heater elements on and off.
  • Gas Handling - I will need to do something with the gas that is generated, while avoiding blowing up the house or garage - I have seen somewhere where they recommend using an aluminised mylar baloon, which sounds like a good idea if I can find one.
  • Gas Composition Measurement - I will need to find out the proportion of methane to carbon dioxide that I am generating - still not sure how to do that.   It would be possible with a tunable IR laser diode, but not sure if that is feasible without spending real money.  Any suggestions appreciated!
  • Gas volume measurement - the other thing I am interested in is how much gas is generated - not sure how best to measure very low gas flow rates.  I am wondering about modifying a U-bend type airlock to detect how many bubbles pass through - maybe detect the water level changing before the bubble passes through.
If this looks feasible, the next stages of development would be:
  • Automate gas handling to use the gas generated to heat the digester - success would be making it self sustaining so that it generated enough gas to keep it warm.  That would mean scaling it up would produce excess gas that I could use for something, else.
  • Think about how far I can scale it up - depends on what fuel to use - kitchen and 'soft' garden waste is limited, so might have to look for something else....
Will post an update when I get it doing something.


Saturday 5 October 2013

Using Raspberry Pi as an IP Camera to Analogue Converter

I have an old-fashioned analogue TV distribution system in our house.   We use it for a video monitor for our disabled son so we can check he is ok.
The quality of the analogue camera we use is not good, but rather than getting a new analogue one, I thought I should really get into digital IP cameras.
I have had quite a nice IP camera with decent infra-red capabilities for a while (a Ycam Knight).   You can view the images and hear the audio on a computer, but it is not as useful as it working on the little portable flat panel TVs we have installed in a few rooms for the old analogue camera.

I am trying an experiment using a raspberry Pi to take the audio and video from the IP camera, and convert it to analogue signals so my old equipment can be used to view it.

What we have is:

  • IP Camera connected to home network.
  • Raspberry Pi connected to same network.
  • Analogue video and audio signals from Pi connected to an RF modulator, which is connected to our RF distribution system.
Using this I can tune the TVs on the RF distribution system to view the Raspberry Pi output.

I set up the Pi to view the audio and video streams from the IP camera by using the omxplayer video player, which is optimised for the Pi.   I added the following to /etc/rc.local:
omxplayer rtsp://192.168.1.18/live_mpeg4.sdp &
Now when the Pi boots, it displays the video from the IP camera on its screen, which is visible to other monitors via the RF modulator.

My concern is how reliable this will be - I tried earlier in the year and the Pi crashed after a few weeks with a completely mangled root filesystem, which is no good at all.   This time I am using a new Pi and new SD card for the filesystem, so I will see how long it lasts.

Sunday 22 September 2013

Human Power Meters

I have just done a triathlon with my disabled son, Benjamin (team-bee.blogspot.co.uk)

While we were training I started to try to calculate the energy requirements for the event, because I was worried about running out of glycogen before the end.   Most of the calculation methods can not take account of weather - especially wind, so I am starting to wonder how to make a power meter for our bike.   I can either go for strain gauges in the cranks, which is likely to be difficult mechanically, or I am wondering if I can just use my heart rate.
I have just got a Garmin 610 sports watch with heart rate monitor.  It uses a wireless protocol called 'ant'.  I'll have to look at how good heart rate is as a surrogate for power output.
I may have to go to a gym to calibrate myself against a machine that measures work done...a winter project I think!

Sunday 24 March 2013

Further Development of Video Based Seizure Detector

I have made a bit more progress with the video based epileptic seizure detector.

Someone on the OpenCV Google Plus page suggested that I look at the Lucas-Kanade feature tracking algorithm, rather than trying to analyse all of the pixels at once like I was doing.

This looks quite promising.  First you have to decide which features in the image to use - corners are good for tracking.  OpenCV has a neat cv.GoodFeaturesToTrack function which makes suggestions - you give it a couple of parameters, including a 'quality' parameter to help it choose.  This gives a list of (x,y) coordinates of the good features to track.  Note that this means 'good' mathematically, not necessarily the limbs of the test subject....

Once you have some features to track, OpenCV again provides a cv.CalcOpticalFlowPyrLK, where you give it the list of features, the previous image and a new image, and it calculates the locations of the features in the new image.

I have then gone into the fourier analysis that I have been trying for the other types of seizure detection. This time I calculate the speed of each feature over a couple of seconds, and record this as a time series, then calculate the fourier transform to give the frequency spectrum of the motion.   If there is oscillation above a threshold amplitude in a given frequency band for a specified time we raise an alarm as a possible seizure.

The code is functioning, but is a fair way off being operational yet.  The code for this is in my OpenSeizureDetector github repository (https://github.com/jones139/OpenSeizureDetector).

The current issues are:

  • I really want to track motion of limbs, but there is no guarantee that cv.GoodFeaturesToTrack will detect these as good features - I can make this more likely by attaching reflective tape, which glows under IR illumination from the night vision camera...if I can persuade Benjamin to wear it.
  • There is something wrong with the frequency calculation still - I can understand a factor of two, but it seems a bit more than that.
  • If the motion is too quick, it looses the point, so I have to set it to re-initialise using GoodFeaturesToTrack periodically.
  • An Example of it working with my daughter doing Benjamin-like behaviour is shown below.   Red circles are drawn around points if a possible seizure is detected.
  • This does not look too good - lots of points detected, and even the reflective strips on the wrists and ankles get lost.  It seems to work better in darkness though, where I get something like the second video, where there are only a few points, and most of those are on my high-vis reflective strips.

  • It does give some nice debugging graphs of the speed measurements and the frequency spectra though.
So, still a bit of work to do.....


Saturday 9 March 2013

First go at a Video Based Epileptic Seizure Detector

Background

I have been working on a system to detect epileptic seizures (fits) to raise an alarm without requiring sensors to be attached to the subject.
I am going down three routes to try to do this:

  • Accelerometers
  • Audio
  • Video
This is about my first 'proof of concept' go at a video based system.

Approach

I am trying to detect the shaking of a fit.  I will do this by monitoring the signal from an infrared video camera, so it will work in monochrome.  The approach is:
  1. Reduce the size of the image by averaging pixels into 'meta pixels' - I do this using the openCV pyrDown function that does the averaging (it is used to build image pyramids of various resolution versions of an image).  I am reducing the 640x480 video stream down to 10x7 pixels to reduce the amount of data I have to handle.
  2. Collect a series of images to produce a time series of images.  I am using 100 images at 30 fps, which is about 3 seconds of video.
  3. For each pixel in the images, calculate the fourier transform of the series of measured pixel intensities - this gives the frequency at which the pixel intensity is varying.
  4. If the amplitude of oscillation at a given frequency is above a threshold value, treat this as a motion at that particular frequency (ie, it could be a fit).
  5. The final version will check that this motion continues for several seconds before raising an alarm.  In this test version, I am just  highlighting the detected frequency of oscillation on the original video stream.

Code

The code uses the OpenCV library, which provides a lot of video and image handling functions - far more than I understand...
My intention had been to write it in C, but I struggled with memory leaks (I must have been doing something wrong and not releasing storage, because it just ate all my computer's memory until it crashed...).
Instead I used the Python bindings for OpenCV - this ran faster and used much less memory than my C version (this is a sign that I made mistakes in the C one, rather than Python being better!).
The code for the seizure detector is here - very rough 'proof of concept' one at the moment - it will have a major rewrite if it works.

Test Set Up

To test the system, I have created a simple 'test card' video, which has a number of circles oscillating at different frequencies - the test is to see if I can pick out the various frequencies of oscillation.  The code to produce the test video is here....And here is the test video (not very exciting to watch I'm afraid).
The circles are oscillating at between 0 and 8 Hz (when played at 30 fps).

Results

The output of the system is shown in the video below.  The coloured circles indicate areas where motion has been detected.  The thickness of the line and the colour shows the frequency of the detected motion.
  • Blue = <3 hz="" li="">
  • Yellow = 3-6 Hz
  • Red = 6-9 Hz
  • White = >9 Hz

The things to note are:
  • No motion detected near the stationary 0 Hz circle (good!).
  • <3hz 1="" 2="" and="" circles="" detected="" good="" hz="" li="" motion="" near="" the="">
  • 3-6 Hz motion detected near the 2,3,4 and 5 Hz circles (ok, but why is it near the 2Hz one?)
  • 6-9 Hz motion detected near the 5 and 6 Hz circles (a bit surprising)
  • >9Hz motion detected near the 4 and 7 Hz circles and sometimes the 8Hz one (?)
So, I think it is sometimes getting the frequency too high.  This may be as simple as how I am doing the  check - it is using the highest frequency that exceeds the threshold.  I think I should update it to use the frequency with maximum amplitude (which exceeds the thershold).
Also, I have something wrong with positioning the markers to show the motion - I am having to convert from a pixel in the low res image to the location in the high resolution one, and it does not always match up with the position of the moving circles.

But, it is looking quite promising.  Rather computer intensive at the moment though - it is using pretty much 100% of one of the CPU cores on my Intel Core I5 laptop, so not much chance of getting this to run on a Raspberry Pi, which was my intention.


Saturday 2 March 2013

Getting Started with OpenCV

I am starting work on the video version of my Epileptic Seizure detector project, while I wait for a very sensitive microphone to arrive off the slow boat from China, which I will use for the Audio version.

I am using the OpenCV computer vision library.  What I am hoping to do is to either:

  • Detect the high frequency movement associated with a seizure, or
  • Detect breathing (and raise an alarm if it stops)
This seems quite similar to the sort of things that MIT have demonstrated some success with last year (http://people.csail.mit.edu/mrub/vidmag/).   Their code is written in Matlib, which is a commercial package, so not much use to me, so I am looking at doing something similar in OpenCV.

But first things first, I need to get OpenCV working.  I am going to use plain old C, because I know the syntax (no funny '<'s in the code that you seem to get in C++).  I may move to Python if I start to need to plot graphs to understand what is happening, so I can use the matplotlib graphical library.

I am using CMake to sort out the make file.  I really don't know how this works - I must have found a tutorial somewhere that told me to create a file called CMakeLists.txt.  Mine looks like:
cmake_minimum_required(VERSION 2.8)
PROJECT( sd )
FIND_PACKAGE( OpenCV REQUIRED )
ADD_EXECUTABLE( sd Seizure_Detector.c )
TARGET_LINK_LIBRARIES( sd ${OpenCV_LIBS} )
Running 'cmake' creates a standard Makefile, and then typing 'make' will compile Seizure_Detector.c and link it into an executable called 'sd', including the OpenCV libraries.   Seems quite clever.

The program to detect a seizure is going to have to look for changes in a series of images in a certain frequency range (a few Hz I think).   To detect this I will need to collect a series of images, process them, and do some sort of Fourier transform to detect the frequency components.

So to get started, grab an image from the networked camera.  This seems to work:
IplImage *origImg = 0;
char *window1 = "Original";
int main() {
    camera = cvCaptureFromFile("rtsp://192.168.1.18/live_mpeg4.sdp");
    if(camera!=NULL) {
    cvNamedWindow(window1,CV_WINDOW_AUTOSIZE);
    while((origImg=cvQueryFrame(camera)) != NULL) {
      procImg = cvCreateImage(cvGetSize(origImg),8,1);
      cvShowImage(window1,origImg);
    }
}
}

I can also smooth the image, and do some edge detection:

    while((origImg=cvQueryFrame(camera)) != NULL) {
      procImg = cvCreateImage(cvGetSize(origImg),8,1);
      cvCvtColor(origImg,procImg,CV_BGR2GRAY);
      //cvSmooth(procImg, procImg, CV_GAUSSIAN_5x5,9,9,0,0);
      smoothImg = cvCreateImage(cvGetSize(origImg),8,1);
      cvSmooth(procImg, smoothImg, CV_GAUSSIAN,9,9,0,0);
      cvCanny(smoothImg,procImg,0,20,3);
   
      cvShowImage(window1,origImg);
      cvShowImage(window2,procImg);
}

Full code at https://github.com/jones139/arduino-projects/tree/master/seizure_detector/video_version.

I am about to update the code to maintain a set of the most recent 15 images (=1 second of video), so I can do some sort of time series analysis on it to get the frequencies.....


Sunday 24 February 2013

Epileptic Seizure Detector (3)

I installed an accelerometer on the underside of the floorboard where my son sleeps to see if there is any chance of detecting him having an epileptic seizure by the vibrations induced in the floor.
I used the software for the seizure detector that I have been working with before (see earlier post).

The software logs data to an SD card in Comma-Separated-Values (CSV) format, recording the raw accelerometer reading, and the calculated spectrum once per second.  This left me with 26 MB of data to analyse after running it all night.....

I wrote a little script in Python that uses the matplotlib library to visualise it.   I create a 2 dimensional array where there is one column for each record in the file (ie once column per second).  The rows are the frequency bins from the fourier transform.  The values in the array are the amplitude of the spectral component from the fourier transform.
The idea is that I can look for periods where I have seen high levels of vibration at different frequencies to see if it could detect a seizure.  The results are shown below:
Here you can see the background noise of a few counts in the 1-7 Hz range.   The 13-15Hz signal is a mystery to me.  I wonder if it is the resonant frequency of our house?
Up to 170 sec is just me walking around the room - discouragingly little response - maybe something at about 10 Hz.  This is followed by me sitting still on the floorboard up to ~200 seconds (The 10 Hz signal disappears?)
The period at ~200 seconds is me stamping vigorously on the floorboard, to prove that the system is alive.
Unfortunately the period after 200 seconds is me lying on the floorboard shaking as vigorously as I could, and it is indistinguishable from the normal activity before 170 seconds.

So, I think attaching a simple IC accelerometer to a floorboard will not work - attaching it directly to the patient's forearm looks very promising, but not the floorboard.

I am working on an audio breathing detector now as the next non-contact option....

The code to analyse the data and produce the above chart can be found on github.  It uses the excellent matplotlib scientific visualisation package.

Wednesday 13 February 2013

Epileptic Seizure Detector (2)

Update to add another spectrum...

I have been working on setting up the Epileptic Seizure Detector.  I tried wearing it for a while, and simulating the shaking associated with a tonic-clonic seizure.   Some example spectra collected on the memory card are shown below:
This shows that the background noise level is at about 4 counts.   
Wearing the accelerometer on the biscep gives a peak up to about 8 counts at 7 Hz, but it is not well defined.  
Wearing the accelerometer on the wrist gives a much more well defined peak at 6-7 Hz. (and it raised an alarm nicely).

I have also tried an ADXL345 digital accelerometer.  The performance is similar to the analogue one, but I think it may be slightly more sensitive.  Example spectra with the accelerometer attached to the biscep are shown below.  ONe is a simulated fit.  The other is a false alarm going down the stairs.  Not that much difference!


Therefore I think there is scope for this set up to work if it is worn as a wrist watch, but just attaching it to other parts of the body may not be sensitive enough.

I wonder if I could make a wrist sensor that is watch sized, with a wireless link to a processor / alarm unit?

Not sure if I will be able to persuade Benjamin to wear a wrist sensor though....Might have to think about microphones.